MongoDB Indexing Strategies for Startups at Scale (2026)


Written by
Bhalli B
Full-Stack Engineer & SaaS MVP Architect
Certified Full-Stack Developer & MVP Specialist · Lahore, Pakistan
A MongoDB collection that crosses roughly 1-5 million documents will punish any query that isn't backed by a purpose-built index, because the query planner falls back to a full collection scan the moment your filter, sort, or projection doesn't match an existing index shape - and that scan cost grows linearly while your traffic grows exponentially. I've taken production collections from 400ms p95 query latency down to under 15ms by rebuilding the index strategy alone, with zero application code changes. This post is the exact framework I use to design, measure, and validate indexes before a startup's data outgrows its assumptions.
1. Why Do MongoDB Queries Collapse Once You Pass a Few Million Documents?
The first sentence answers it directly: queries collapse because db.collection.find() without a matching index forces MongoDB to run a COLLSCAN - reading every document in the collection into memory and evaluating the filter document-by-document, which is O(n) against collection size instead of O(log n) against a B-tree.
Below roughly 50,000 documents, a COLLSCAN is often faster than an index lookup because the whole collection fits in the WiredTiger cache and the planner overhead of an index seek isn't worth it. That threshold is exactly why teams don't notice the problem in staging - staging data is small, and the query "works fine." I've had a client's orders collection go from 30,000 rows in QA to 3.2 million rows six weeks after launch, and the same find({ status: 'pending', createdAt: { $gte: cutoff } }) query went from 12ms to 1,900ms with zero code changes. Nothing broke. The data just grew past the point where a scan is tolerable.
You can confirm this yourself with .explain('executionStats'):
// Run this against any query you suspect is unindexed.
// executionStats gives you real numbers, not just the winning plan shape.
const plan = await db.orders.find({
  status: "pending",
  createdAt: { $gte: new Date("2026-06-01") }
}).explain("executionStats");

console.log(plan.executionStats.totalDocsExamined); // documents physically scanned
console.log(plan.executionStats.nReturned);          // documents actually matching
console.log(plan.executionStats.executionTimeMillis);

// Red flag: totalDocsExamined >> nReturned means the planner is
// scanning far more documents than it needs to return.
// A ratio above ~10:1 on a hot-path query is your signal to add an index.
A totalDocsExamined of 3.2 million against an nReturned of 400 is not a bug - it's the expected behavior of an unindexed query, and it's the single most common root cause I see when a founder tells me "the app got slow after we launched."
2. Which MongoDB Index Type Actually Matches Your Query Pattern?
MongoDB doesn't have one "index" - it has at least six distinct index types, and picking the wrong one is worse than picking none, because an unused index still costs you write latency on every insert and update without ever paying off on reads.
As a Certified Project Manager, I run every new collection through a short audit before it ships: for each query the application actually issues (pulled straight from the API route handlers, not guessed), I map it to exactly one index type below and reject any index that doesn't trace back to a real, currently-shipping query.
| Index Type | Best For | Write Overhead | Common Mistake |
|---|---|---|---|
| Single Field | One filter field, e.g. userId | Low | Indexing a field with low cardinality (e.g. a 3-value status enum) alone |
| Compound | Multi-field filter + sort queries | Medium | Wrong field order - breaks the ESR rule (Section 3) |
| Multikey | Querying inside array fields, e.g. tags | Medium | Combining two multikey fields in one compound index - MongoDB forbids this outright |
| Text | Free-text search across string fields | High | Using it for prefix/autocomplete search instead of a proper Atlas Search index |
| Wildcard | Dynamic/unpredictable schemas (e.g. per-tenant custom fields) | High | Applying it to the whole document instead of scoping with wildcardProjection |
| Columnstore | Analytical aggregations over a subset of fields at large scale | Medium | Using it for OLTP point lookups it wasn't designed for |
3. How Do You Order Fields in a Compound Index? (The ESR Rule)
The ESR rule - Equality, Sort, Range - dictates the field order inside a compound index, and getting this order wrong is the single most common indexing mistake I audit out of client codebases. Fields that are matched with strict equality (status: "pending") go first, fields used for sorting go second, and fields matched with range operators ($gte, $lt, $in on large sets) go last.
// Index defined as: { createdAt: 1, status: 1 }
await db.orders.createIndex({ createdAt: 1, status: 1 });

// Query
db.orders.find({
  status: "pending",
  createdAt: { $gte: cutoff }
});
Because the range field leads, the index can only narrow down by date and then must linearly scan every document in that date range checking status - on a 3M-row orders collection this examined 640,000 documents for a query that returned 900.
// Index defined as: { status: 1, createdAt: 1 }
await db.orders.createIndex({ status: 1, createdAt: 1 });

// Same query, now hits the index correctly
db.orders.find({
  status: "pending",
  createdAt: { $gte: cutoff }
});
The index first narrows to the "pending" bucket (a small slice of the collection), then does a tight range seek within it - the same query dropped from 640,000 documents examined to 1,100.
4. What Does Over-Indexing Actually Cost You on Writes?
Every index you add is not free at read time - it's a recurring tax on every insertOne, updateOne, and deleteOne that touches that document, because MongoDB has to update every index's B-tree structure on every write, not just the primary keyed one.
T = B + (N × I)
I've inherited collections with 14 indexes where only 5 were ever hit by a real query - the other 9 existed because a past developer added one every time a query felt slow instead of diagnosing which index it actually needed. Run db.collection.aggregate([{ $indexStats: {} }]) quarterly and drop anything with an accesses.ops count near zero.
5. How Do You Index a Sharded Collection Without Creating Hot Shards?
Once a single replica set can't hold your working set in RAM - typically somewhere past 500GB-1TB of active data depending on your Atlas tier - you shard, and the shard key you choose interacts directly with your indexes, because every query that doesn't include the shard key gets broadcast to every shard (a "scatter-gather" query) instead of routed to one.
The mistake I see most often on startups' first sharding attempt is using a monotonically increasing shard key like createdAt or the default _id, which concentrates all new writes onto a single shard - the exact opposite of what sharding is for. A hashed shard key on a high-cardinality field ({ userId: "hashed" }) distributes writes evenly, but then every query needs a compound index that leads with userId to stay routed rather than scattered.
// mongoose schema for a sharded, multi-tenant "events" collection
// at 20M+ documents. Shard key is userId (hashed), so every hot-path
// query MUST filter on userId first or it scatters across all shards.
import mongoose from "mongoose";

const eventSchema = new mongoose.Schema({
  userId: { type: mongoose.Schema.Types.ObjectId, required: true, index: false }, // indexed via compound below, not alone
  eventType: { type: String, required: true, enum: ["click", "view", "purchase"] },
  payload: { type: mongoose.Schema.Types.Mixed },
  createdAt: { type: Date, default: Date.now },
}, { collection: "events" });

// Compound index: userId first (matches the hashed shard key routing),
// then eventType (equality), then createdAt (range) - follows ESR.
eventSchema.index({ userId: 1, eventType: 1, createdAt: -1 });

// Partial index: most queries only ever look at "purchase" events
// for revenue reporting, so we skip indexing the 90% of rows that
// are "click"/"view" - cuts this index's size by roughly 8x on
// a typical clickstream distribution.
eventSchema.index(
  { userId: 1, createdAt: -1 },
  { partialFilterExpression: { eventType: "purchase" } }
);

export const Event = mongoose.model("Event", eventSchema);
Enabling sharding on the collection itself requires the key match the leading index field:
// Run once, from a mongosh session connected to the mongos router.
// The shard key MUST be a prefix of (or exactly match) an existing
// index, or MongoDB refuses to shard the collection.
sh.shardCollection("app.events", { userId: "hashed" });

// Confirm even distribution across shards before going live -
// a skewed chunk distribution here means a tenant with disproportionately
// heavy usage is about to become a hot shard.
db.events.getShardDistribution();
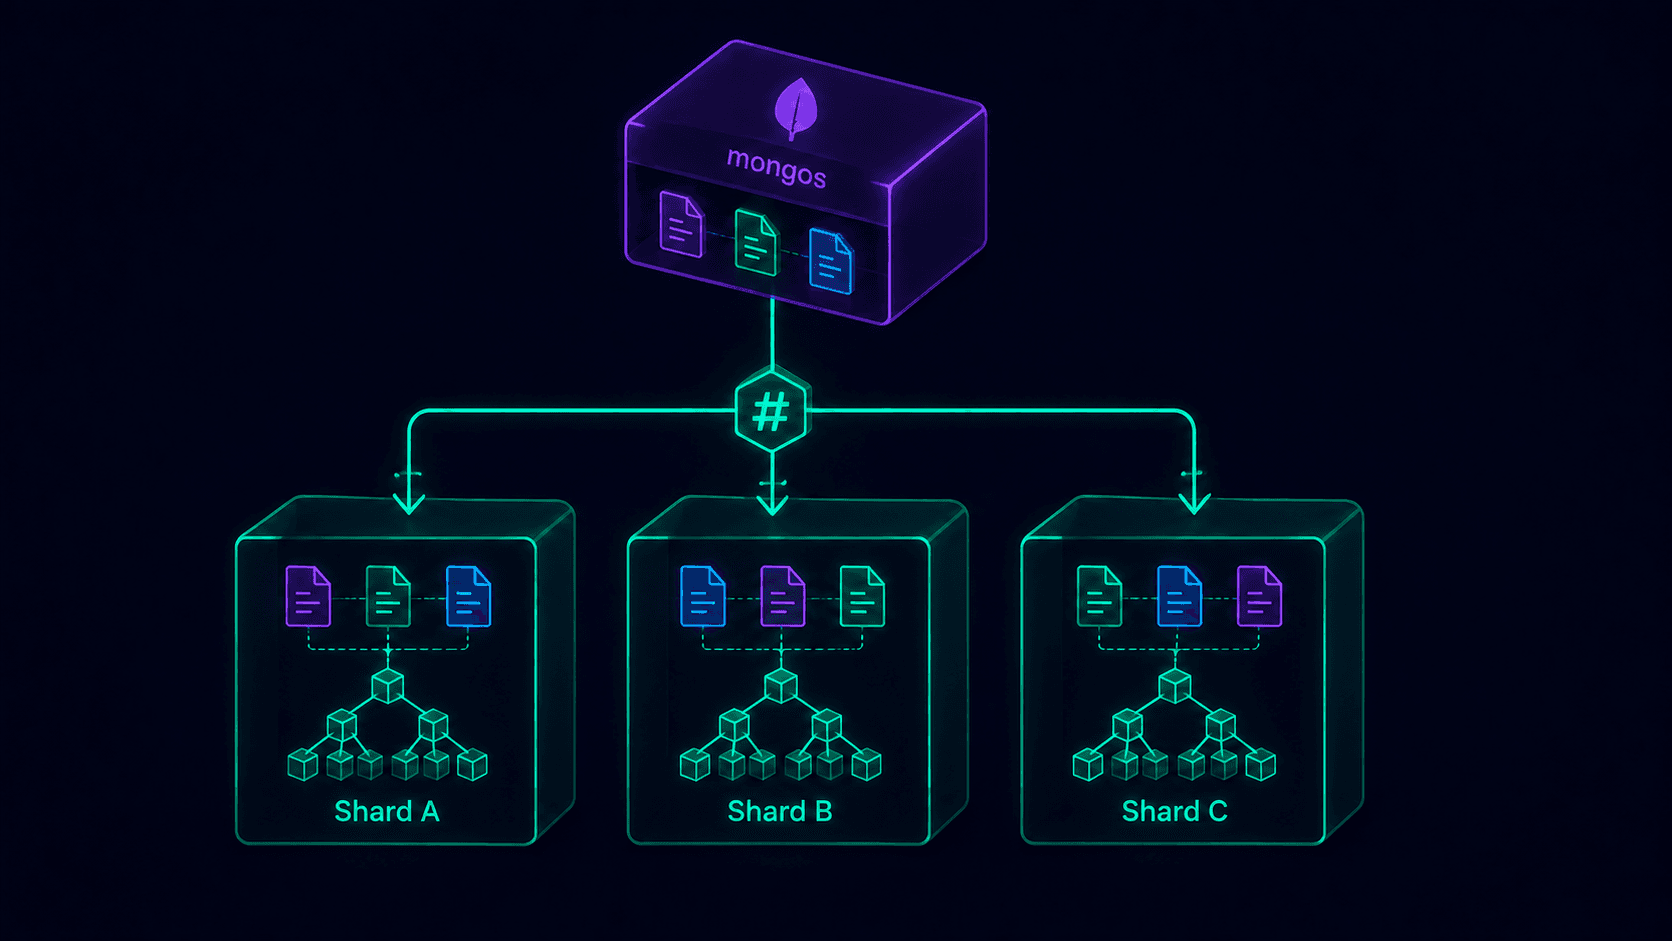 Figure 1: A hashed shard key on
 userId distributing writes evenly across three shards, each maintaining the same compound { userId, eventType, createdAt } index locally so queries route to a single shard instead of scattering.
6. Conclusion and Actionable Roadmap
The core argument holds regardless of which stage you're at: an index strategy isn't a performance nice-to-have you bolt on after launch, it's a structural decision that has to match your real query patterns from the first migration, because retrofitting indexes onto a live collection with millions of rows means running createIndex in the background against production traffic and hoping the write-lock contention doesn't spike your p99. Get the ESR field order right, keep indexes traceable to real queries with $indexStats, and choose a shard key that matches your leading compound index - and the same collection that chokes at 400ms today can hold steady under 15ms well past 10 million documents.
Get a MongoDB indexing audit before your next traffic spike finds the gaps for you: I review your real query patterns, run explain() against your actual production indexes, and hand back a prioritized index migration plan - built on the same Node.js/Next.js/MongoDB stack I use to ship production SaaS MVPs end to end. Contact me today to book a 30-minute database performance audit.